War and Peace
xalpha.ai
The absolute number of war deaths has been declining since 1946. In some years in the early post-war era, around half a million people died through direct violence in wars. In recent years, the annual death toll tends to be less than 100,000. The decline of the absolute number of battle deaths can be seen in the visualization here that shows global battle deaths per year by world region. There are three marked peaks in war deaths since then: the Korean War (early 1950s), the Vietnam War (around 1970), and the Iran-Iraq and Afghanistan wars (1980s). There has been a recent increase in battle deaths driven by conflict in the Middle East, particularly in Syria, Iraq and Afghanistan.
The chart above refers only to battle deaths occurring in conflicts that involved at least one state on one of the opposing sides. For more recent years, we show these ‘state-based’ conflict deaths alongside battle deaths in ‘non-state’ conflicts (where two or more organisations are fighting but no state is involved), and also violent deaths in ‘one-sided violence’ (where there is only one organised aggressor, such as in genocidal violence). We see that, in recent years, state-based conflicts form the majority of such deaths, though the genocide in Rwanda in 1994 stands out for its very high death-toll.
The previous two graphs showed absolute numbers, but as the world has seen rapid population growth (see our entry on global population growth), it is more appropriate to look at relative numbers. Here we show the battle death in state-based conflicts per 100,000 people per year. The figures are shown by type of conflict.
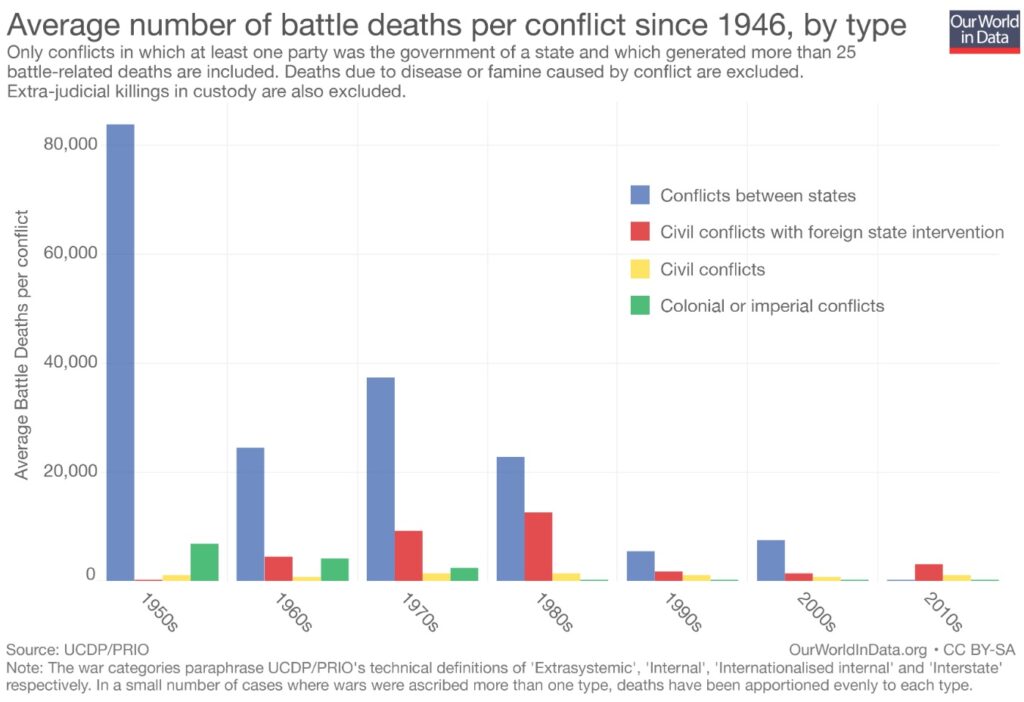
The stacked area chart here shows the number of ongoing conflicts each year has risen. This increase however only relates to civil conflicts within states. Conflicts related to the expansion or defence of colonial empires ended with decolonisation. Conflicts between states have almost ceased to exist. But the number of war victims varies hugely between different wars: whereas 1,200,000 died during the the Korean War (1950–1953), other wars had ‘just’ 1,000 victims. For this reason, statistics on the number of wars need to be interpreted alongside data on the size of these conflicts. The increase in the number of wars is predominantly an increase of smaller conflicts. This follows from the previously shown declining number of war victims while the number of conflicts increased. The decreasing deadliness of conflicts can be seen in the bar chart.